California home sales dipped slightly in November 2017 from a year ago, while the median sales price recorded its highest year-over-year gain since January 2016, the California Association of Realtors reported today.
Closed escrow sales of existing, single-family detached homes in California totaled a seasonally adjusted annualized rate of 440,340 units in November, according to information collected by C.A.R. from more than 90 local Realtor associations and MLSs statewide.
The statewide sales figure represents what would be the total number of homes sold during 2017 if sales maintained the November pace throughout the year. It is adjusted to account for seasonal factors that typically influence home sales.
The November sales figure was up 2.1 percent from the 431,080 level in October and down 0.8 percent compared with home sales in November 2016 of a revised 443,960. The annual sales dip is largely attributed to an unseasonably strong sales pace last November.
Year-to-date sales are running 1.5 percent ahead of last year’s pace, but the annual sales pace has been declining since first quarter 2017.
“The state’s housing market performed better than we anticipated in November, despite a slowdown in sales activity in the second half of the year,” said 2018 C.A.R. President Steve White.
“While high-priced markets have performed well in recent months, sales remain lackluster in the lower-priced segments as the supply of affordable homes continues to shrink,” White said. “This tale of two markets is not a story that we enjoy telling as the dichotomy in the market is posing some affordability challenges to many potential homebuyers who want to enter the market.”
After reaching its highest level in a decade in August, the statewide median price was essentially flat from October but remained above the $500,000 mark for the ninth straight month.
The $546,820 November median price was 0.1 percent higher than October’s $546,430 price but climbed 8.8 percent from the revised $502,490 recorded in November 2016.
The year-over-year gain was the highest since January 2016.
The median sales price is the point at which half of homes sold for more and half sold for less; it is influenced by the types of homes selling, as well as a general change in values.
“The statewide median home price increased year-over-year at the highest rate in nearly two years, which was faster than what we anticipated earlier in the year,” said C.A.R. Senior Vice President and Chief Economist Leslie-Appleton-Young.
“With the Federal Reserve hiking its benchmark interest rate last week, we expect more rate increases next year as the Fed attempts to keep inflation in check,” Young said. “As rates rise, the cost of homeownership will go up, and housing affordability will further deteriorate if the trend continues.”

Other key points from C.A.R.’s November 2017 resale housing report include:
* The Los Angeles Metro and Inland Empire regions recorded year-over-year sales declines of 3.5 percent and 6.2 percent, respectively, while sales in the San Francisco Bay Area inched up 0.7 percent from last year.
* In the Bay Area, where the region continues to reflect dire market conditions of tight supply and low affordability, sales dropped from October in four of the nine counties in the area. Sales in San Francisco and San Mateo counties grew slightly, while Marin and Napa had very strong gains of 20.6 percent and 22.5 percent, respectively.
Additionally, sales in Sonoma County rebounded 25.2 percent from the October wildfires.
The four counties that reported monthly sales losses were Alameda, Contra Costa, Santa Clara, and Solano counties.
* The Southern California region had slower sales with every county reporting monthly and annual declines (barring a flat Orange).
In the Southland – Los Angeles, San Bernardino, and Riverside reported monthly drops of 12.6 percent, 15.9 percent, and 9.1 percent, respectively while San Diego, Orange County and Ventura had declines of 10.4 percent, 4.2 percent and 7.0 percent, respectively.
* Home prices across the state continued to grow in general in November. Forty-five of the 51 reported counties recorded a year-over-year price increase, with 23 of them growing at double-digit rates. The Bay Area had the strongest price appreciation among all regions with a 12.5 percent regional annual price increase.
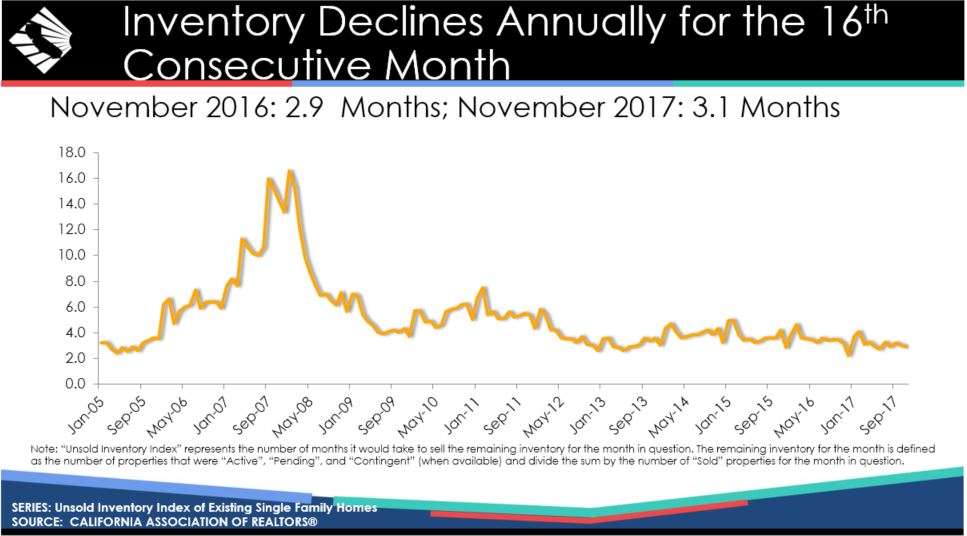
* Statewide active listings continued to decline in November, dropping 11.5 percent from a year ago. Since the beginning of the year, active listings have declined by more than 10 percent every month, and the number of available listings for sale has trended downward for more than two years.
* With housing inventory remaining at stubbornly low levels, the statewide unsold inventory index dropped from 3.0 months in October 2016 to 2.9 months in November. The index measures the number of months needed to sell the supply of homes on the market at the current sales rate. The index stood at 3.1 months in November 2017.
* In the Bay Area and Southern California, supply has been especially low; every single county in the Southern California region (aside from San Bernardino) had a reduction in listings from the previous year in November. Active listings in Los Angeles, Orange, Riverside, and San Diego counties all declined by more than 8 percent from last year.
In the Bay Area, every county had fewer active listings from last year with declines of nearly 17 percent for the region and a 36 percent year-over-year decline in active listings in Santa Clara.
* With a dearth of available homes on the market, the median number of days it took to sell a single-family home in November was 22 days compared with 30 days in November 2016.
* C.A.R.’s sales price-to-list price ratio* was 98.9 percent statewide in November, 98.9 percent in October, and 98.2 percent in November 2016.
* The statewide price per square foot hit another high since 2007, with the average price per square foot** for an existing, single-family home statewide at $277 in November, up from $254 in November 2016.
* Mortgage rates edged higher in November as 30-year, fixed-mortgage interest rates averaged 3.92 percent in November, up from 3.90 percent in October and from 3.77 percent in November 2016, according to Freddie Mac.
The five-year, adjustable-rate mortgage interest rate also ticked higher in November to an average of 3.24 percent from 3.18 percent in October and from 2.74 percent in November 2016.
* Sales-to-list price ratio is an indicator that reflects the negotiation power of home buyers and home sellers under current market conditions. The ratio is calculated by dividing the final sales price of a property by its last list price and is expressed as a percentage. A sales-to-list ratio with 100 percent or above suggests that the property sold for more than the list price, and a ratio below 100 percent indicates that the price sold below the asking price.
** Price per square foot is a measure commonly used by real estate agents and brokers to determine how much a square foot of space a buyer will pay for a property. It is calculated as the sale price of the home divided by the number of finished square feet. C.A.R. currently tracks price-per-square foot statistics for 39 counties.
Leading the way… in California real estate for more than 110 years, the California Association of Realtors (www.car.org) is one of the largest state trade organizations in the United States with more than 190,000 members dedicated to the advancement of professionalism in real estate. C.A.R. is headquartered in Los Angeles.
Like this:
Like Loading...
Related


 Tweet This
 Facebook
 Digg This
 Bookmark
 Stumble
 RSS
RSS


REAL NAMES ONLY: All posters must use their real individual or business name. This applies equally to Twitter account holders who use a nickname.
0 Comments
You can be the first one to leave a comment.