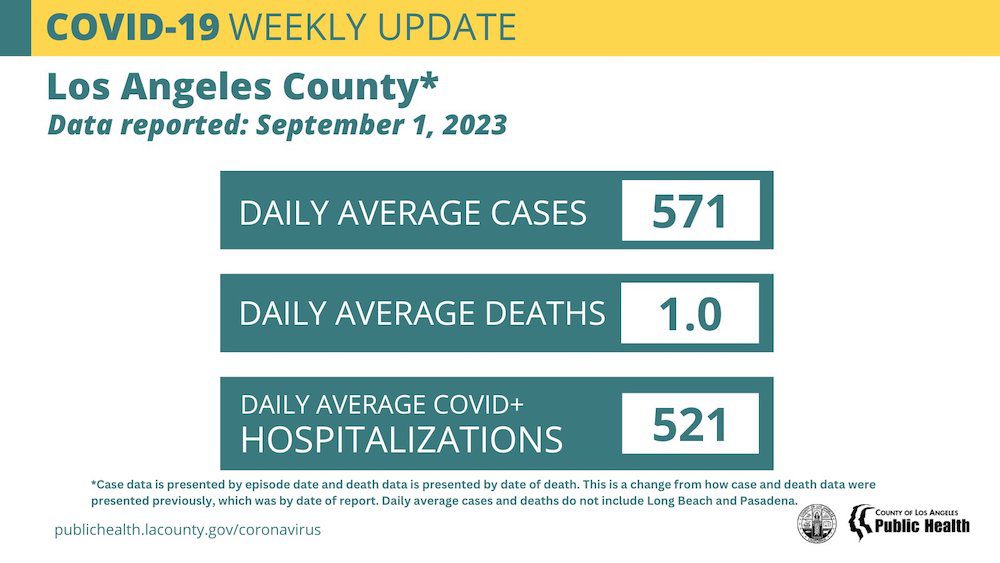
The Los Angeles County Department of Public Health confirmed Friday 232 new cases and no additional deaths from COVID-19 in the Santa Clarita Valley within the last week.
Public Health is now reporting COVID-19 data once a week. This is the most recent data from Sept. 1.
This new data brings Los Angeles County death totals to 36,628, case totals to 3,783,352 and Santa Clarita Valley case totals to 100,983 since March of 2020. SCV deaths from COVID-19 remain at 571.
Reducing COVID-19 Spread During Labor Day Weekend
To reduce the spread of COVID-19 over the Labor Day weekend, Public Health is offering simple steps for people who want to lower their risk of getting infected while celebrating the holiday.
With a rise in COVID-19 transmission in Los Angeles County, there are many reasons people may want to take extra measures to protect themselves against infection, including if they are older, have a weakened immune system or chronic health condition, want to avoid missing work, school or other activities or are concerned about infecting more vulnerable people around them.
Approaching Labor Day weekend, Los Angeles County is seeing the sixth consecutive week of increased measures of COVID-19 transmission. At gatherings and celebrations, some straightforward steps can help increase safety against COVID-19, including holding events outside when possible, opening windows when gathering indoors for increased ventilation and requesting that people test before getting together.
Public Health also recommends testing when someone has been exposed to COVID-19 or if they have possible symptoms, including a cough, fever, headache or unusual fatigue. To access free COVID-19 testing in Los Angeles County, visit http://publichealth.lacounty.gov/covidtests.
Masking is currently based on individual preference, except when required during outbreaks or by the site. People who are at higher risk of severe illness should consider wearing a high-quality, well-fitting mask when in crowded and/or poorly ventilated indoor spaces. For everyone, masking is strongly recommended on public transit and in health care settings. In addition, people should mask around others for 10 days if they are exposed to COVID-19 or for days 6-10 after an infection if leaving isolation.
Currently, Los Angeles County is reporting a daily average of 521 COVID-positive hospitalizations, just over a 20 percent increase from the week prior and twice as high as what was reported 4 weeks ago. The proportion of emergency department visits attributed to COVID-19 this week is 5.1 percent, an increase from 3.2 percent reported on Aug. 2.
In the past, new variants and sub-variants have often fueled increases in transmission. Los Angeles County continues to regularly sequence local COVID-19 specimens to know what strains are circulating and to prepare if changes will affect the impact of COVID-19.
According to the most recent local sequencing data for the two-week period ending Aug. 5, the most dominant strain in Los Angeles County was EG.5, which accounted for 22 percent of sequenced specimens. This is the first time a strain has accounted for more than 20 percent of sequenced specimens since early July. The next most dominant strain is XBB.1.5, accounting for almost 14% of sequenced specimens.
Because it takes time to sequence positive specimens, the U.S. Centers for Disease Control and Prevention (CDC) uses modeling to predict the proportion of strains circulating right now. As of Sept. 1, for the U.S. region that includes California and surrounding states, it is estimated that EG.5 remains dominant and accounts for 29% of current cases.
Anyone infected with COVID-19 should talk to their health care provider about treatment options, such as Paxlovid, as soon as possible. Treatment must begin within five days of the onset of symptoms. To access free telehealth services for treatment, contact the Public Health Call Center, seven days a week from 8 a.m. to 8:30 p.m., at 1-833-540-0473.
Los Angeles County remains in the CDC’s Low Hospital Admission Level with 6.3 weekly COVID-19 hospital admissions per 100,000 people, reported on Aug. 28 for the seven-day period ending Aug. 19, an increase from 5.2 hospital admissions last week.
Public Health reports COVID-19 data weekly. The following table shows case, wastewater, emergency department, hospitalization and death data in Los Angeles County over the past four weeks:

A wide range of data and dashboards on COVID-19 from the Los Angeles County Department of Public Health are available on the Public Health website at http://www.publichealth.lacounty.gov including:
COVID-19 Locations & Demographics (data by demographic characteristics and geography, active outbreaks, and citations)
– COVID-19 Response Plan
– COVID-19 Vaccinations
– Skilled Nursing Facility Metrics
Always check with trusted sources for the latest accurate information about novel coronavirus:
– Los Angeles County Department of Public Health: http://publichealth.lacounty.gov/media/Coronavirus/
– California Department of Public Health: https://www.cdph.ca.gov/Programs/CID/DCDC/Pages/Immunization/nCOV2019.aspx
– Centers for Disease Control and Prevention: https://www.cdc.gov/coronavirus/2019-ncov/index.html
– CDC Spanishhttps://espanol.cdc.gov/enes/coronavirus/2019-ncov/index.html
– World Health Organization https://www.who.int/health-topics/coronavirus
– LA County residents can also call 2-1-1
William S. Hart Union High School District COVID-19 Dashboard
Since the State of Emergency has been lifted, the William S. Hart Union High School District will no longer be posting dashboard information.
Santa Clarita Valley Update
As of 2 p.m. Friday, the L.A. County Public Health dashboard reported not additional deaths from COVID-19 in the Santa Clarita Valley, keeping the total number of deaths in the SCV at 571.
NOTE: As of Dec. 20, 2022, the Los Angeles County Department of Public Health switched to a new geocoding process to improve the accuracy and completeness of geocoded data. Geocoding is the process of assigning an address to specific geographic coordinates (latitude/longitude). As a result, approximately 1,500 cases (0.04%) were removed from the cumulative count as they were determined to be out of jurisdiction with the improved geocoding. The switch to this improved process also resulted in minor changes to cumulative case/death counts by Supervisor District, Service Planning Area, city/community, and area poverty categories.
The following is the community breakdown per L.A. County’s dashboard:
Santa Clarita: 465
Castaic: 31 (revised from 33)
Acton: 19 (revised from 19)
Stevenson Ranch: 19
Unincorporated Canyon Country: 11
Agua Dulce: 8
Val Verde: 6
Elizabeth Lake: 4
Lake Hughes: 2
Valencia: 2
Unincorporated Bouquet Canyon: 2
Newhall: 1
Unincorporated Saugus/Canyon Country: 1
SCV Cases
Of the 100,983 cases reported to Public Health for the SCV to date, the community breakdown is as follows:
Santa Clarita: 74,557
Castaic: 9,834
Stevenson Ranch: 6,097
Canyon Country: 3,822
Acton: 2,049
Val Verde: 1,234
Agua Dulce: 1,005
Valencia: 953
Saugus: 351 (revised from 352)
Elizabeth Lake: 291
Bouquet Canyon: 207
Lake Hughes: 207
Saugus/Canyon Country: 138
Newhall: 107
Sand Canyon: 63
San Francisquito: 44
Placerita Canyon: 24
*Note: The county is unable to break out separate numbers for Castaic and PDC/NCCF because the county uses geotagging software that cannot be changed at this time, according to officials. Click here for the LASD COVID-19 dashboard.
California By the Numbers
The most updated data as of Sept. 1:

New hospital admissions updated Sept. 1, at 9:36 a.m., with data from Aug. 26.
Deaths and tests updated Sept. 1, at 9:36 a.m., with data from Aug. 29.
For more California data, click [here].
Like this:
Like Loading...
Related


 Tweet This
 Facebook
 Digg This
 Bookmark
 Stumble
 RSS
RSS


REAL NAMES ONLY: All posters must use their real individual or business name. This applies equally to Twitter account holders who use a nickname.
0 Comments
You can be the first one to leave a comment.