The Los Angeles County Department of Public Health confirmed Thursday 61 new cases and two additional deaths from COVID-19 in the Santa Clarita Valley within the last week.
Public Health is now reporting COVID-19 data every Thursday. This is the most recent data from July 6.
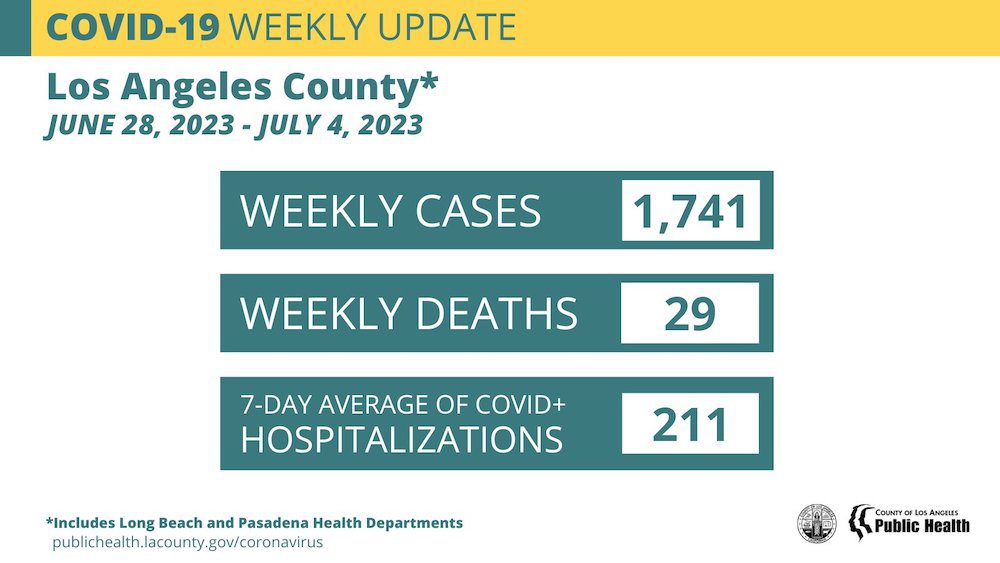
This new data brings Los Angeles County death totals to 36,536, case totals to 3,757,342 and Santa Clarita Valley case totals to 99,836 since March of 2020. SCV deaths from COVID-19 rise to 568.
Despite Six Steady Weeks of COVID-19 Metrics, Public Health Will Continue to Monitors Data
Public Health marks more than six weeks of steady COVID-19 metrics, not recording any significant changes in case, death or hospitalization numbers, officials continue to monitor global and local data in preparation for mitigating any potential increases in COVID-19 transmission in Los Angeles County.
Two of the indicators that Public Health officials are tracking are: Seasonal COVID-19 trends observed locally in past years and current COVID-19 transmission in the Southern Hemisphere from April through September, during their winter, foreshadowing respiratory illness patterns that could be seen in the Northern Hemisphere this fall.
Los Angeles County experienced a COVID-19 summer surge in 2020, 2021 and 2022, with COVID hospitalizations increasing by up to 300 percent between June 1 and Aug. 1 in each of those years. While there are no current signs of a summer surge in Los Angeles County, Public Health continues to monitor data to assess the impact of large 4th of July gatherings and increased travel on transmission rates in the summer of 2023. As a precaution, residents are encouraged to continue common-sense measures against COVID-19, including staying home when ill, testing when COVID-19 symptoms or exposure are present, and staying up to date on vaccines.
Public Health officials also are monitoring changing COVID-19 trends throughout the Southern Hemisphere in anticipation of what to possibly expect in Los Angeles County this winter. Current global case trends from the Southern Hemisphere indicate that low COVID transmission in summer does not preclude a winter surge.
One month ago, Australia reported a 28 percent increase in COVID-19 cases and experts declared a seventh COVID wave after a summer of steady case levels. Between the first week of June and the first week of July, COVID-19 deaths in Australia nearly quadrupled. Currently, according to data from the World Health Organization, reported cases are trending upward in Chile and New Zealand. Other Southern Hemisphere countries, including Brazil and Kenya, saw an uptick in cases over the past month with trends now starting to stabilize. While reported case numbers are generally an undercount due to wide availability of at-home testing, they are a reliable indicator of trends in COVID-19 transmission.
As the global pandemic continues, there are many potential drivers that can cause a rise in cases, including increased dominance of new COVID-19 strains. Based on the U.S. Centers for Disease Control and Prevention (CDC) modeling for California and surrounding states, it is predicted that as of June 24, XBB.1.5 remains dominant, accounting for over 27 percent of COVID-19 cases with XBB.1.16 being the second most dominant, accounting for nearly 19 percent of cases. XBB.1.9.2 is estimated to account for about 15 percent of cases. The currently circulating COVID-19 strains in Los Angeles County are all descendants of Omicron.
Knowing that a virus with the potential for severe impact continues to circulate, Public Health maintains preparedness measures, including having therapeutics for COVID-19 treatment readily available at over 750 sites throughout the county and distributing test kits through libraries, community-based organizations, and Public Health vaccine sites. In June of 2023, over 1.1 million test kits were distributed across more than 2,000 sites. Protecting vulnerable people in the community is best accomplished when all residents take advantage of these resources, reducing the chance of unintentional transmission.
If people have questions about when to test, possible symptoms, recommended vaccines, or require telehealth services, the Public Health Call Center is available 7 days a week, from 8 a.m. to 8:30 p.m., at 1-833-540-0473.
The CDC has replaced COVID-19 Community Levels with Hospital Admission Levels, which can help individuals and communities decide which prevention actions they can take based on the most recent information. Los Angeles County is in the Low Hospital Admission Level with 3.0 weekly COVID-19 hospital admissions per 100,000 people, reported on July 3 for the seven-day period ending June 24.
Public Health reports COVID-19 data weekly. The following table shows case, wastewater, emergency department, hospitalization, and death data in Los Angeles County over the past four weeks. All metrics remain stable at levels of low concern.

A wide range of data and dashboards on COVID-19 from the Los Angeles County Department of Public Health are available on the Public Health website at http://www.publichealth.lacounty.gov including:
COVID-19 Locations & Demographics (data by demographic characteristics and geography, active outbreaks, and citations)
– COVID-19 Response Plan
– COVID-19 Vaccinations
– Skilled Nursing Facility Metrics
Always check with trusted sources for the latest accurate information about novel coronavirus:
– Los Angeles County Department of Public Health: http://publichealth.lacounty.gov/media/Coronavirus/
– California Department of Public Health: https://www.cdph.ca.gov/Programs/CID/DCDC/Pages/Immunization/nCOV2019.aspx
– Centers for Disease Control and Prevention: https://www.cdc.gov/coronavirus/2019-ncov/index.html
– CDC Spanishhttps://espanol.cdc.gov/enes/coronavirus/2019-ncov/index.html
– World Health Organization https://www.who.int/health-topics/coronavirus
– LA County residents can also call 2-1-1
William S. Hart Union High School District COVID-19 Dashboard
Since the State of Emergency has been lifted, the William S. Hart Union High School District will no longer be posting dashboard information.
Santa Clarita Valley Thursday Update
As of 4 p.m. Thursday, the L.A. County Public Health dashboard reported two additional deaths from COVID-19 in the city of Santa Clarita, bringing the total number of deaths in the SCV to 568.
NOTE: As of Dec. 20, 2022, the Los Angeles County Department of Public Health switched to a new geocoding process to improve the accuracy and completeness of geocoded data. Geocoding is the process of assigning an address to specific geographic coordinates (latitude/longitude). As a result, approximately 1,500 cases (0.04%) were removed from the cumulative count as they were determined to be out of jurisdiction with the improved geocoding. The switch to this improved process also resulted in minor changes to cumulative case/death counts by Supervisor District, Service Planning Area, city/community, and area poverty categories.
The following is the community breakdown per L.A. County’s dashboard:
Santa Clarita: 463
Castaic: 30 (revised from 33)
Acton: 19 (revised from 19)
Stevenson Ranch: 19
Unincorporated Canyon Country: 11
Agua Dulce: 8
Val Verde: 6
Elizabeth Lake: 4
Lake Hughes: 2
Valencia: 2
Unincorporated Bouquet Canyon: 2
Newhall: 1
Unincorporated Saugus/Canyon Country: 1
SCV Cases
Of the 99,897 cases reported to Public Health for the SCV to date, the community breakdown is as follows:
Santa Clarita: 73,800
Castaic: 9,687
Stevenson Ranch: 6,017
Canyon Country: 3,788
Acton: 2,025
Val Verde: 1,226
Agua Dulce: 997
Valencia: 940
Saugus: 347
Elizabeth Lake: 288
Bouquet Canyon: 207
Lake Hughes: 204
Saugus/Canyon Country: 135
Newhall: 105
Sand Canyon: 63
San Francisquito: 44
Placerita Canyon: 24
*Note: The county is unable to break out separate numbers for Castaic and PDC/NCCF because the county uses geotagging software that cannot be changed at this time, according to officials. Click here for the LASD COVID-19 dashboard.
California Thursday By the Numbers
While daily press releases are no longer available from CDPH, data will continue to be updated weekly on the state’s COVID-19 dashboard.
As of July 6, California has confirmed a total of 102,350 COVID-19 deaths.

Hospitalizations updated July 6, at 12:25 p.m., with data from July 1.
Deaths and Tests updated June 29, at 9:36 a.m., with data from June 27.
For more California data, click [here].
Like this:
Like Loading...
Related


 Tweet This
 Facebook
 Digg This
 Bookmark
 Stumble
 RSS
RSS


REAL NAMES ONLY: All posters must use their real individual or business name. This applies equally to Twitter account holders who use a nickname.
0 Comments
You can be the first one to leave a comment.