The Los Angeles County Department of Public Health confirmed Thursday 48 new cases and no additional deaths from COVID-19 in the Santa Clarita Valley within the last week.
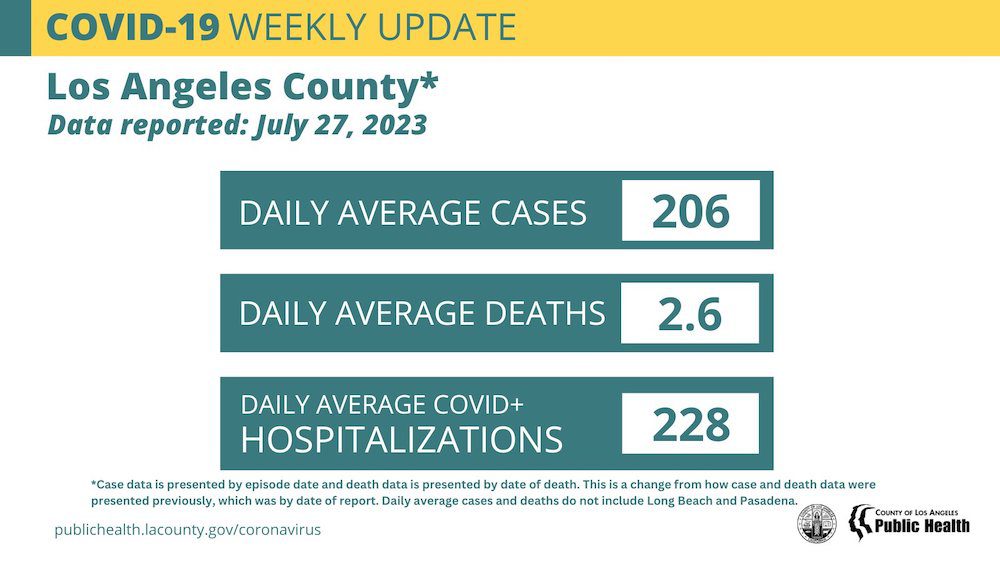
Public Health is now reporting COVID-19 data every Thursday. This is the most recent data from July 27.
This new data brings Los Angeles County death totals to 36,574, case totals to 3,763,078 and Santa Clarita Valley case totals to 100,097 since March of 2020. SCV deaths from COVID-19 remain at 568.
Hospitalizations and Deaths Remain Relatively Stable
Public Health continues to monitor indicators of COVID-19, there is evidence of small increases in transmission while hospitalizations and deaths remain relatively stable, likely reflecting built-up protection against severe illness from COVID-19.
Reported cases and wastewater data provide evidence that COVID-19 is circulating in Los Angeles County at somewhat higher levels than seen earlier this summer. However, this small uptick in transmission is not yet driving significantly greater numbers of new hospitalizations or deaths.
Cases have increased more than 35 percent compared to two weeks ago. Nonetheless, in comparison to case counts last July, cases this July are on average 96 percent lower. While helpful to indicate larger trends, case counts are an undercount of the actual number of infections due to the large number of at-home COVID test results that are not reported to Public Health.
Wastewater concentrations of SARS CoV-2, the virus that results in a COVID-19 infection, are at 16 percent of the most recent winter peak for the week ending July 15, double the 8 percent that was reported two weeks ago, yet still of low concern. Looking at wastewater concentrations of SARS-CoV-2 provides information about transmission levels and is not dependent on cases reported or captured through testing.
The percentage of Emergency Department encounters classified as COVID-19 related is 2.7%, a nominal increase from 2.4% reported two weeks ago and the daily average number of COVID-positive hospitalizations is 228, a very small increase from 213 reported two weeks ago. The daily average for COVID-19 deaths is 2.6, slightly less than a daily average of 3.4 deaths two weeks prior.
In alignment with the state of California, Los Angeles County has begun counting and reporting only deaths where COVID-19 is coded on the death certificate as the cause of death or a contributing factor. This new definition for categorizing deaths is being applied to all deaths with a date of death on July 1, 2023, or later. Updating the definitions associated with deaths caused by specific diseases is a normal part of disease surveillance, reflecting both changes in the evolution of the disease and resource constraints.
Los Angeles County will also monitor and report three additional indicators of COVID-19 mortality to maximize the ability to detect changes in mortality trends.
First, Public Health will report on the percentage of all Los Angeles County deaths that are due to COVID-19. This provides a measure of the relative burden of COVID on overall mortality in Los Angeles County and captures changes in the impact of COVID over time.
Second, Public Health will track the number of deaths that don’t have COVID-19 listed on the death certificate yet were reported by a medical provider as COVID-associated. This will capture additional deaths likely associated with COVID that may be under-reported on death certificates.
Last, regular updates will be provided by Public Health on the leading causes of death in Los Angeles County. In 2022, COVID-19 was the third leading cause of death, behind coronary heart disease and Alzheimer’s disease. Based on death numbers to date, we anticipate a significant decrease in the ranking of COVID-19 this year. This will capture the contribution of COVID to resident mortality rates and can inform response actions and resource allocations.
For residents who are concerned that they or a loved one have been exposed to COVID-19 or are seeking resources for increased protection, many options remain available in Los Angeles County. The Public Health Call Center is open seven days a week, from 8 a.m. to 8:30 p.m. The free service will connect callers with a person who can answer their questions, coordinate free telehealth care to receive COVID-19 treatment, and help make a vaccination appointment, including for people who are homebound. The number is 1-833-540-0473.
The U.S. Centers for Disease Control and Prevention (CDC) has replaced COVID-19 Community Levels with Hospital Admission Levels, which can help individuals and communities decide which prevention actions they can take based on the most recent information. Los Angeles County is in the Low Hospital Admission Level with 2.7 weekly COVID-19 hospital admissions per 100,000 people, reported on July 24 for the seven-day period ending July 25.
Public Health reports COVID-19 data weekly. The following table shows case, wastewater, emergency department, hospitalization, and death data in Los Angeles County over the past four weeks.

Public Health will now report case and death counts by episode date and date of death, a change from previously reported weekly counts that represented the number of cases and deaths newly confirmed as COVID-associated for the particular week.
A wide range of data and dashboards on COVID-19 from the Los Angeles County Department of Public Health are available on the Public Health website at http://www.publichealth.lacounty.gov including:
COVID-19 Locations & Demographics (data by demographic characteristics and geography, active outbreaks, and citations)
– COVID-19 Response Plan
– COVID-19 Vaccinations
– Skilled Nursing Facility Metrics
Always check with trusted sources for the latest accurate information about novel coronavirus:
– Los Angeles County Department of Public Health: http://publichealth.lacounty.gov/media/Coronavirus/
– California Department of Public Health: https://www.cdph.ca.gov/Programs/CID/DCDC/Pages/Immunization/nCOV2019.aspx
– Centers for Disease Control and Prevention: https://www.cdc.gov/coronavirus/2019-ncov/index.html
– CDC Spanishhttps://espanol.cdc.gov/enes/coronavirus/2019-ncov/index.html
– World Health Organization https://www.who.int/health-topics/coronavirus
– LA County residents can also call 2-1-1
William S. Hart Union High School District COVID-19 Dashboard
Since the State of Emergency has been lifted, the William S. Hart Union High School District will no longer be posting dashboard information.
Santa Clarita Valley Thursday Update
As of 5 p.m. Thursday, the L.A. County Public Health dashboard reported no additional deaths from COVID-19 in the Santa Clarita Valley, keeping the total number of deaths in the SCV at 568.
NOTE: As of Dec. 20, 2022, the Los Angeles County Department of Public Health switched to a new geocoding process to improve the accuracy and completeness of geocoded data. Geocoding is the process of assigning an address to specific geographic coordinates (latitude/longitude). As a result, approximately 1,500 cases (0.04%) were removed from the cumulative count as they were determined to be out of jurisdiction with the improved geocoding. The switch to this improved process also resulted in minor changes to cumulative case/death counts by Supervisor District, Service Planning Area, city/community, and area poverty categories.
The following is the community breakdown per L.A. County’s dashboard:
Santa Clarita: 463
Castaic: 30 (revised from 33)
Acton: 19 (revised from 19)
Stevenson Ranch: 19
Unincorporated Canyon Country: 11
Agua Dulce: 8
Val Verde: 6
Elizabeth Lake: 4
Lake Hughes: 2
Valencia: 2
Unincorporated Bouquet Canyon: 2
Newhall: 1
Unincorporated Saugus/Canyon Country: 1
SCV Cases
Of the 100,097 cases reported to Public Health for the SCV to date, the community breakdown is as follows:
Santa Clarita: 73,976
Castaic: 9,729
Stevenson Ranch: 6,034
Canyon Country: 3,783 (revised from 3,795)
Acton: 2,027
Val Verde: 1,224 (revised from 1,229)
Agua Dulce: 1,000
Valencia: 944
Saugus: 352
Elizabeth Lake: 289
Bouquet Canyon: 207
Lake Hughes: 206
Saugus/Canyon Country: 134 (revised from 135)
Newhall: 105
Sand Canyon: 63
San Francisquito: N/A
Placerita Canyon: 24
*Note: The county is unable to break out separate numbers for Castaic and PDC/NCCF because the county uses geotagging software that cannot be changed at this time, according to officials. Click here for the LASD COVID-19 dashboard.
California Thursday By the Numbers
As of July 27, California has confirmed a total of 102,977 COVID-19 deaths.

Hospitalizations updated July 27, at 10:06 a.m., with data from July 22.
Deaths and Tests updated July 27, at 10:06 a.m., with data from July 25.
For more California data, click [here].
Like this:
Like Loading...
Related


 Tweet This
 Facebook
 Digg This
 Bookmark
 Stumble
 RSS
RSS


REAL NAMES ONLY: All posters must use their real individual or business name. This applies equally to Twitter account holders who use a nickname.
0 Comments
You can be the first one to leave a comment.