The Los Angeles County Department of Public Health confirmed Thursday 60 new cases and three new deaths from COVID-19 in the Santa Clarita Valley within the last week.
Public Health is now reporting COVID-19 data every Thursday. This is the most recent data from June 1.
This new data brings Los Angeles County death totals to 36,424, case totals to 3,749,879 and Santa Clarita Valley case totals to 99,642 since March of 2020. SCV deaths from COVID-19 increase to 563.
Commonsense Protective Measures Encouraged During Summertime Travel
Simple precautions can aid in preventing vacation disruptions.
As many Los Angeles County residents make summer travel plans, the Los Angeles County Department of Public Health encourages people to take common-sense measures while traveling to avoid contracting and spreading COVID-19, especially at this time of year, when case rates and hospitalizations typically have risen.
For the past three years, Los Angeles County has experienced a significant increase in transmission between June and August, peak summer months when increased travel, celebrations and gatherings have contributed to summer surges. Protective measures, such as handwashing, testing, and staying home when sick, are essential to dampening the spread of COVID-19.
Although data shows that COVID-19 transmission remains low in Los Angeles County, across the course of the pandemic, COVID hospitalizations, an indicator of COVID-19’s impact on the community, have increased during summer months, coinciding with school breaks and summer vacations.
During the first year of the pandemic, COVID-19 hospitalizations rose 40 percent between June 1, 2020, and Aug. 1, 2020. The next year, despite hospitalizations reaching a pandemic-low in June of 2021 at an average of 218 hospitalizations per day, Los Angeles County saw a summer surge during which hospitalizations increased by nearly 300 percent between June 1 and Aug. 1. In 2022 the hospitalization increase was over 150 percent during the same summer months.
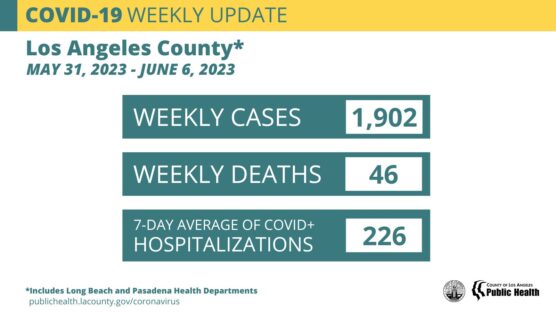
As of June 4, the 7-day average of COVID-19 hospitalizations in Los Angeles County was 226, one of the lowest hospitalization averages since the pandemic began.
Any COVID-19 infection brings risk, including the risk of long COVID, and the chance that the virus may be spread to someone who is more at-risk for severe illness. At the very least, summer gatherings and travel plans can be disrupted. To reduce risks during travel, L.A. Public Health urges all residents to take simple precautions, including staying home when sick, masking while using public transportation, and testing if a person is experiencing respiratory symptoms or has been exposed to COVID-19. For added protection, it is also recommended that people traveling together are up to date on COVID vaccines before departure.
In California, insurance plans, including Medicare and Medi-Cal, are required to cover the cost of testing for COVID-19 through Nov. 11, 2023. Exact coverage may vary depending on an individual’s insurance plan. Residents without insurance may receive free at-home test kits or PCR tests for COVID-19 at public libraries, public health clinics, vaccination sites and community health centers or purchase tests from a pharmacy or other local retailer. Having tests on hand while traveling can help detect a COVID-19 infection as soon as possible.
COVID-19 treatments, taken within five days of symptom onset, can help reduce the chance of severe illness from COVID. Anyone traveling for an extended period of time should make a plan with their provider or insurance about how to access treatment in case of infection. For questions about treatment, testing, steps to prevent COVID-19 while traveling, or anything related to COVID-19, the Public Health Call Line remains available every day, from 8 a.m. to 8:30 p.m., by calling 1-833-540-0473.
In addition to increased COVID-19 exposure due to travel and summertime events, an increase in cases also can be caused by mutations to the virus. Currently in Los Angeles County, the most recent sequencing data shows XBB.1.5 remains the dominant strain, accounting for 66 percent of sequenced specimens for the two-week period ending May 13, a decrease from 74 percent during the previous reporting period. The second most dominant strains were XBB.1.9.1 and XBB.1.9.2, accounting for 9 percent and 7 percent of sequenced specimens, respectively, an increase from the prior two-week period.
Modeling data from the U.S. Centers for Disease Control and Prevention estimates that as of May 27 in California and surrounding states, XBB.1.5 remains the dominant strain accounting for 53 percent of cases while XBB.1.16 makes up 14 percent and XBB.1.9.1 accounts for about 13 percent of cases. These shifts are small, and officials do not note a cause for concern at this time.
“I would like to extend my deepest sympathies to those who have lost a loved one to COVID-19. May you find peace and comfort during this difficult time,” said Dr. Barbara Ferrer, Ph.D., M.P.H., M.Ed., Director of the Los Angeles County Department of Public Health. “Like many people, I am looking forward to the summer months and plans with family and friends. More than anything I hope that our numbers remain low and that we start to see a new pattern of COVID-19, with more predictability and fewer surges. As the virus and the circumstances of the pandemic continue to evolve, more will be known about the long-term outlook of COVID-19. For now, all residents are encouraged to use the knowledge we have gained over the past 3+ years, especially when participating in higher risk activities, such as travel. While these activities are lower risk than in past summers, they are not no-risk, especially for people who are older or immunocompromised. Incorporating simple measures, such as handwashing and testing, can help keep each other safe and make for an enjoyable summer.”
For residents who have difficulties leaving their home, Public Health offers free in-home COVID-19 vaccinations. Appointments may be made at ph.lacounty.gov/vaxathome, or ph.lacounty.gov/vacunacionencasa (en español). Homebound services and other COVID-19 resources, including vaccines, testing and treatment, are free and readily available by calling the Public Health Call Center at 1-833-540-0473 seven days a week between 8 a.m. to 8:30 p.m.
The CDC has replaced COVID-19 Community Levels with Hospital Admission Levels, which can help individuals and communities decide which prevention actions they can take based on the most recent information. Los Angeles County is in the Low Hospital Admission Level with 3.0 weekly COVID-19 hospital admissions per 100,000 people, reported June 1.
The 7-day average number of COVID hospitalizations is 226 this week. Reported weekly deaths increased to 46 deaths reported this week. As of Tuesday, June 6, there have been a total of 36,424 COVID deaths in Los Angeles County.
Public Health reports COVID-19 data weekly. The following table shows case, wastewater, emergency department, hospitalization, and death data in Los Angeles County over the past four weeks.

1) Case counts are an underrepresentation of the true number of infections, largely due to home tests which are not reported to DPH. Despite this, the trend in reported case counts from week to week is still an indicator of overall trends in transmission.
2) Weekly case and death counts represent the number of cases and deaths reported for the week ending each Tuesday. The date a case/death is reported by DPH is not the same as the date of testing or death.
3) Time periods covered by each metric: wastewater = week ending each Saturday, with a one-week lag; ED data = week ending each Sunday; hospitalizations = week ending each Sunday.
4) Data for past weeks is subject to change in future reports.
*Due to a reporting transition at the state level and subsequent underreporting from hospitals, this value is an undercount. Efforts are actively underway to address the underreporting.
A wide range of data and dashboards on COVID-19 from the Los Angeles County Department of Public Health are available on the Public Health website at http://www.publichealth.lacounty.gov including:
COVID-19 Locations & Demographics (data by demographic characteristics and geography, active outbreaks, and citations)
– COVID-19 Response Plan
– COVID-19 Vaccinations
– Skilled Nursing Facility Metrics
Always check with trusted sources for the latest accurate information about novel coronavirus:
– Los Angeles County Department of Public Health: http://publichealth.lacounty.gov/media/Coronavirus/
– California Department of Public Health: https://www.cdph.ca.gov/Programs/CID/DCDC/Pages/Immunization/nCOV2019.aspx
– Centers for Disease Control and Prevention: https://www.cdc.gov/coronavirus/2019-ncov/index.html
– CDC Spanishhttps://espanol.cdc.gov/enes/coronavirus/2019-ncov/index.html
– World Health Organization https://www.who.int/health-topics/coronavirus
– LA County residents can also call 2-1-1
William S. Hart Union High School District COVID-19 Dashboard
Since the State of Emergency has been lifted, the William S. Hart Union High School District will no longer be posting dashboard information.
Santa Clarita Valley Thursday Update
As of 4 p.m. Thursday, the L.A. County Public Health dashboard reported two additional deaths from COVID-19 in the city of Santa Clarita and one additional death in Action bringing the total number of deaths in the SCV to 563.
NOTE: As of Dec. 20, 2022, the Los Angeles County Department of Public Health switched to a new geocoding process to improve the accuracy and completeness of geocoded data. Geocoding is the process of assigning an address to specific geographic coordinates (latitude/longitude). As a result, approximately 1,500 cases (0.04%) were removed from the cumulative count as they were determined to be out of jurisdiction with the improved geocoding. The switch to this improved process also resulted in minor changes to cumulative case/death counts by Supervisor District, Service Planning Area, city/community, and area poverty categories.
The following is the community breakdown per L.A. County’s dashboard:
Santa Clarita: 459
Castaic: 30 (revised from 33)
Acton: 19 (revised from 19)
Stevenson Ranch: 18
Unincorporated Canyon Country: 11
Agua Dulce: 8
Val Verde: 6
Elizabeth Lake: 4
Lake Hughes: 2
Valencia: 2
Unincorporated Bouquet Canyon: 2
Newhall: 1
Unincorporated Saugus/Canyon Country: 1
SCV Cases
Of the 99,642 cases reported to Public Health for the SCV to date, the community breakdown is as follows:
Santa Clarita: 73,647
Castaic: 9,634
Stevenson Ranch: 5,998
Canyon Country: 3,774
Acton: 2,017
Val Verde: 1,225
Agua Dulce: 996
Valencia: 936
Saugus: 346
Elizabeth Lake: 288
Bouquet Canyon: 207
Lake Hughes: 203
Saugus/Canyon Country: 135
Newhall: 105
Sand Canyon: 63
San Francisquito: 44
Placerita Canyon: 24
*Note: The county is unable to break out separate numbers for Castaic and PDC/NCCF because the county uses geotagging software that cannot be changed at this time, according to officials. Click here for the LASD COVID-19 dashboard.
California Thursday By the Numbers
With the recent end of the California COVID-19 State of Emergency, CDPH will sunset weekly COVID-19 data news releases. All data will continue to be updated regularly on the state’s COVID-19 data dashboard on Thursdays.
As of June 8, California has confirmed a total of 102,133 COVID-19 deaths.

For more California data, click [here].
Like this:
Like Loading...
Related


 Tweet This
 Facebook
 Digg This
 Bookmark
 Stumble
 RSS
RSS


REAL NAMES ONLY: All posters must use their real individual or business name. This applies equally to Twitter account holders who use a nickname.
0 Comments
You can be the first one to leave a comment.