The Los Angeles County Department of Public Health confirmed Thursday 89 new cases and no additional deaths from COVID-19 in the Santa Clarita Valley within the last week.
Public Health is now reporting COVID-19 data every Thursday. This is the most recent data from July 20.
This new data brings Los Angeles County death totals to 36,564, case totals to 3,761,107 and Santa Clarita Valley case totals to 100,049 since March of 2020. SCV deaths from COVID-19 remain at 568.
Small Increase in COVID-19 Cases Countywide
With small increases in the number of reported COVID-19 cases in Los Angeles County, Public Health reminds residents to consider taking common-sense precautions, especially for people at highest risk for severe illness from COVID-19.
Public Health data shows increases in reported COVID-19 cases, virus concentrations in wastewater and the percentage of positive COVID-19 tests, possibly the result of high levels of exposure during Fourth of July festivities, summer travel, and the unusually high temperatures that are keeping people indoors more often.
For the past three summers, Los Angeles County has experienced a summer COVID-19 surge. Beginning in mid-July 2021, cases and hospitalizations increased relatively sharply. In contrast, in 2022, cases and hospitalizations had already begun to rise by May 1, however the increase was more gradual.
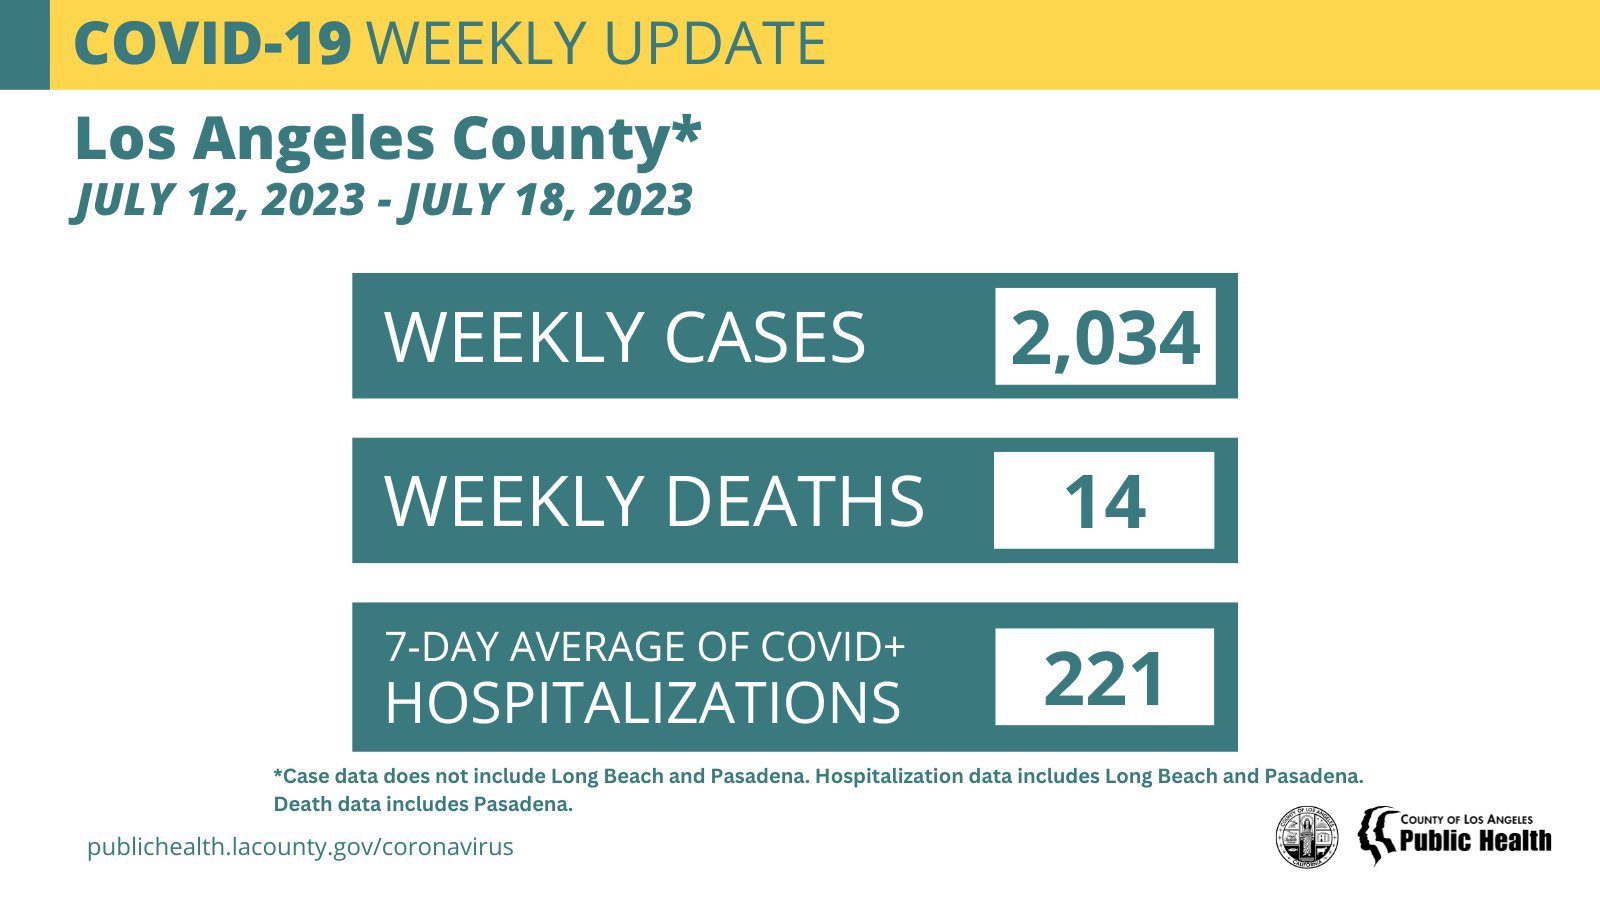
This week, Public Health reports 2,034 new COVID-19 cases, a 32 percent increase from the 1,544 cases reported last week. While helpful to indicate larger trends, cases are an undercount of the true number of infections due to the large number of at-home COVID test results that are not reported to Public Health.
Wastewater concentrations of SARS CoV-2, the virus that results in a COVID-19 infection, are at 10 percent of the most recent winter peak for the week ending July 8, a slight increase from the 8 percent that was recorded for each of the previous three weeks. The test positivity rate, which does not include home tests, increased to 7.5 percent as of July 15, up from 5.1 percent one month earlier.
This month, Public Health also is reporting more new outbreaks in skilled nursing facilities, where residents are more susceptible to severe illness and death from COVID-19. For the week ending July 18, Public Health opened 11 outbreak investigations, similar to the 12 outbreak investigations opened the week before. By comparison, one month ago, for the week ending June 20, four new outbreaks were opened.
While COVID-19 transmission patterns continue to evolve, it is important that county residents take simple precautions to reduce transmission. This includes testing if exposed to COVID-19 or if experiencing symptoms of a respiratory illness, including sore throat, cough or fever. Information about testing, including where to get free tests, is available at ph.lacounty.gov/COVIDtests.
If a person tests positive for COVID-19, they must isolate for at least five full days to prevent inadvertently transmitting the virus to others. Isolation may end during days 6-10 if a person goes more than 24 hours without a fever, without the use of fever reducing medications, and their symptoms are not worsening; a negative COVID-19 test is strongly recommended. When leaving isolation, it is recommended to mask through day 10.
Treatments for COVID-19 continue to be widely available in Los Angeles County. However, these medications are only effective if taken within five days of symptom onset. To get treatment, speak to a provider or contact the Public Health Call Center at 1-833-540-0473. Assistance is available seven days a week, from 8 a.m. to 8:30 p.m.
The U.S. Centers for Disease Control and Prevention (CDC) has replaced COVID-19 Community Levels with Hospital Admission Levels, which can help individuals and communities decide which prevention actions they can take based on the most recent information. Los Angeles County is in the Low Hospital Admission Level with 2.6 weekly COVID-19 hospital admissions per 100,000 people, reported on July 17 for the seven-day period ending July 8.
Public Health reports COVID-19 data weekly. The following table shows case, wastewater, emergency department, hospitalization, and death data in Los Angeles County over the past four weeks.

A wide range of data and dashboards on COVID-19 from the Los Angeles County Department of Public Health are available on the Public Health website at http://www.publichealth.lacounty.gov including:
COVID-19 Locations & Demographics (data by demographic characteristics and geography, active outbreaks, and citations)
– COVID-19 Response Plan
– COVID-19 Vaccinations
– Skilled Nursing Facility Metrics
Always check with trusted sources for the latest accurate information about novel coronavirus:
– Los Angeles County Department of Public Health: http://publichealth.lacounty.gov/media/Coronavirus/
– California Department of Public Health: https://www.cdph.ca.gov/Programs/CID/DCDC/Pages/Immunization/nCOV2019.aspx
– Centers for Disease Control and Prevention: https://www.cdc.gov/coronavirus/2019-ncov/index.html
– CDC Spanishhttps://espanol.cdc.gov/enes/coronavirus/2019-ncov/index.html
– World Health Organization https://www.who.int/health-topics/coronavirus
– LA County residents can also call 2-1-1
William S. Hart Union High School District COVID-19 Dashboard
Since the State of Emergency has been lifted, the William S. Hart Union High School District will no longer be posting dashboard information.
Santa Clarita Valley Thursday Update
As of 2:45 p.m. Thursday, the L.A. County Public Health dashboard reported no additional deaths from COVID-19 in the Santa Clarita Valley, keeping the total number of deaths in the SCV at 568.
NOTE: As of Dec. 20, 2022, the Los Angeles County Department of Public Health switched to a new geocoding process to improve the accuracy and completeness of geocoded data. Geocoding is the process of assigning an address to specific geographic coordinates (latitude/longitude). As a result, approximately 1,500 cases (0.04%) were removed from the cumulative count as they were determined to be out of jurisdiction with the improved geocoding. The switch to this improved process also resulted in minor changes to cumulative case/death counts by Supervisor District, Service Planning Area, city/community, and area poverty categories.
The following is the community breakdown per L.A. County’s dashboard:
Santa Clarita: 463
Castaic: 30 (revised from 33)
Acton: 19 (revised from 19)
Stevenson Ranch: 19
Unincorporated Canyon Country: 11
Agua Dulce: 8
Val Verde: 6
Elizabeth Lake: 4
Lake Hughes: 2
Valencia: 2
Unincorporated Bouquet Canyon: 2
Newhall: 1
Unincorporated Saugus/Canyon Country: 1
SCV Cases
Of the 100,049 cases reported to Public Health for the SCV to date, the community breakdown is as follows:
Santa Clarita: 73,908
Castaic: 9,702
Stevenson Ranch: 6,031
Canyon Country: 3,795
Acton: 2,026
Val Verde: 1,229
Agua Dulce: 998
Valencia: 942
Saugus: 347
Elizabeth Lake: 289
Bouquet Canyon: 207
Lake Hughes: 204
Saugus/Canyon Country: 135
Newhall: 105
Sand Canyon: 63
San Francisquito: 44
Placerita Canyon: 24
*Note: The county is unable to break out separate numbers for Castaic and PDC/NCCF because the county uses geotagging software that cannot be changed at this time, according to officials. Click here for the LASD COVID-19 dashboard.
California Thursday By the Numbers
As of July 20, California has confirmed a total of 102,491 COVID-19 deaths.

Hospitalizations updated July 13, at 9:36 a.m., with data from July 15.
Deaths and Tests updated July 13, at 9:36 a.m., with data from July 18.
For more California data, click [here].
Like this:
Like Loading...
Related


 Tweet This
 Facebook
 Digg This
 Bookmark
 Stumble
 RSS
RSS


REAL NAMES ONLY: All posters must use their real individual or business name. This applies equally to Twitter account holders who use a nickname.
0 Comments
You can be the first one to leave a comment.