The Los Angeles County Department of Public Health confirmed Thursday 224 new laboratory confirmed cases and no new deaths from COVID-19 in the Santa Clarita Valley within the last week.
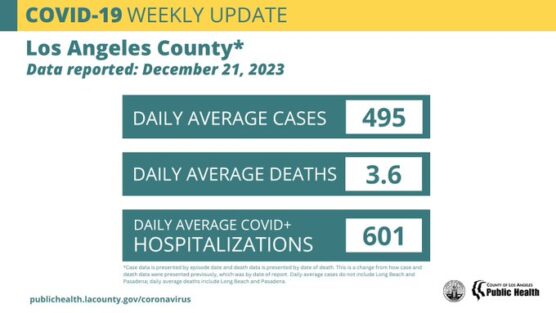
Public Health is now reporting COVID-19 data once a week. This is the most recent data from Dec. 21.
This new data brings Los Angeles County death totals to 37,065 case totals to 3,837,410 and Santa Clarita Valley case totals to 103,217 since March of 2020. SCV deaths from COVID-19 remain at 582.
Common-Sense Precautions offer Important Protection from Exposures, Transmission, Severe Illness
With schools on break and many winter holidays still ahead, the Los Angeles County Department of Public Health (Public Health) recognizes that for many residents this is a magical time of year, filled with opportunities to enjoy the company of family and friends. Everyone is encouraged to take time to connect with those you care about while also taking common-sense precautions to avoid getting sick and spreading illness to others.
Amidst celebrations, it’s important to remain aware of respiratory illnesses currently circulating, especially when there are guests who are more vulnerable to severe illness in attendance. Being proactive to prevent illness leading up to and during events can significantly reduce the risk of travel disruptions, last-minute cancellations, and inadvertently spreading illness, ensuring a more enjoyable holiday season for everyone.
In Los Angeles County, Public Health continues to report increased signs of COVID-19 transmission. This week, Public Health is reporting a daily average of 495 cases, an undercount due to the number of home-test results not reported. This is an 80 percent increase from the daily average of recorded COVID-19 cases one month ago on Nov. 22.
During this same time period, Los Angeles County has also seen a significant rise in SARS-CoV-2, the virus that causes COVID-19, in wastewater concentrations. This week, Public Health is reporting wastewater concentrations that are 39 percent of last year’s winter peak, triple the levels reported one month ago, when wastewater concentrations were 13 percent of last year’s winter peak.
The impact of more COVID-19 circulating in the community can be seen in the rise in the number of COVID-positive hospitalizations in Los Angeles County. This week, Public Health is reporting a daily average of 601 COVID-positive hospitalizations, over a 65 percent increase from one month ago. The daily average of the percentage of Emergency Department visits related to COVID-19 has increased from 3.6 percent to 4.6 percent during the same period.
It is possible that at least part of the local increase in transmission is driven by new COVID-19 strains gaining dominance in Los Angeles County, including JN.1, a newly emerging strain descended from BA.2.86, an Omicron lineage. For specimens collected during the two-week period ending Nov. 25, the most recent data currently available, JN.1 accounted for 10 percent of sequenced specimens, a rapid increase from late October when the strain was first detected in Los Angeles County and accounted for only 1 percent of sequenced specimens.
This same rapid increase has been seen across the United States. The CDC has a predictive model, called the Nowcast, that estimates the proportion at which each strain is circulating for more recent time periods, since it takes a few weeks to get measured data due to the time needed to sequence specimens. The CDC Nowcast estimates that, for the two-week period ending Dec. 9, JN.1 accounts for more than 1 in 5 COVID-19 cases nationally and about 16 percent in Region 9, which includes California. Experts speculate that this may be due to an evolution on the spike protein which gives the new strain greater ability to evade immunity, and therefore, the potential to spread more easily. JN.1 does not, however, appear to be resulting in more severe cases of COVID-19.
Currently, in Los Angeles County, for specimens collected the two-week period ending Nov. 25, strains descended from XBB accounted for 87 percent of sequenced specimens. HV.1 accounted for the highest proportion, at 28 percent, followed by EG.5 at 13 percent, HK.3 at 11 percent, and JN.1 at 10 percent.
To protect against COVID-19 and other respiratory viruses circulating this holiday season, residents should continue to take common-sense precautions. They should wash their hands often or use hand sanitizer, especially before eating, after sneezing or coughing, or when in public places. They also should consider wearing a well-fitted, high-quality mask in crowded indoor spaces, travel hubs or poorly ventilated spaces. People should stay home if they have any symptoms of illness, including coughing, sneezing, a fever or sore throat, and consider talking with friends and family so they know to be cautious about gathering if they show signs of infection.
Now is a good time to stock up on COVID-19 tests and event hosts may want to consider asking their guests to test for COVID-19 before celebrations, especially if older or immunocompromised people will be present. Tests are widely available in Los Angeles County, including at libraries, through community-based organizations, by mail through the federal government, and at local pharmacies through your health insurance policy. More details are available at ph.lacounty.gov/COVIDtests.
Vaccines also continue to provide valuable protection against severe illness. Flu and COVID-19 vaccines are recommended for everyone 6 months and older. People over 60, those with very young children and pregnant people should speak with their provider about the RSV vaccine as well.
If Los Angeles County residents have questions about vaccines, such as where to get vaccinated or how to get tested, the Public Health Call Center remains open seven days a week from 8 a.m. to 8 p.m. at 1-833-540-0473. However, the Call Center will be closed on Dec. 25 and Jan.1 for the holidays. Public Health staff can connect callers with resources and help people schedule vaccination appointments, including in-home vaccinations for those that are homebound. The Public Health Call Center can also be used to access free telehealth services for COVID-19, including a no-cost prescription for Paxlovid, an anti-viral medication to treat COVID-19, if eligible.
In Los Angeles County, based on data through Dec. 9, the U.S. Centers for Disease Control and Prevention Hospital Admission Level is Low at 6.5 new COVID-19 hospitalizations per 100,000 people.
Public Health reports COVID-19 data weekly. The following table shows case, wastewater, emergency department, hospitalization, and death data in Los Angeles County over the past four weeks.
Metric Date of Weekly Report
12/20/2023 12/13/2023 12/6/2023 11/29/2023

All daily averages are 7-day averages. Data for past weeks are subject to change in future reports. Time periods covered by each metric: cases = week ending each Saturday; wastewater = week ending each Saturday, with a one-week lag; ED data = week ending each Sunday; hospitalizations = week ending each Saturday; deaths = week ending each Monday, with a three-week lag; death percentage = week ending Monday, with a one-week lag.
Case data is presented by episode date, an approximation of the date the illness began, and death data is presented by date of death. This is a change from how case and death data were presented prior to July 26, 2023, which was by date of report. Daily average cases do not include Long Beach and Pasadena. Daily average deaths include Long Beach and Pasadena for all weeks except 11/29. Long Beach and Pasadena are not included in the daily average death count for 11/29 because data was not available from CDPH due to the Thanksgiving holiday.
A wide range of data and dashboards on COVID-19 from the Los Angeles County Department of Public Health are available on the Public Health website at http://www.publichealth.lacounty.gov including:
COVID-19 Locations & Demographics (data by demographic characteristics and geography, active outbreaks, and citations)
– COVID-19 Response Plan
– COVID-19 Vaccinations
– Skilled Nursing Facility Metrics
Always check with trusted sources for the latest accurate information about novel coronavirus:
– Los Angeles County Department of Public Health: http://publichealth.lacounty.gov/media/Coronavirus/
– California Department of Public Health: https://www.cdph.ca.gov/Programs/CID/DCDC/Pages/Immunization/nCOV2019.aspx
– Centers for Disease Control and Prevention: https://www.cdc.gov/coronavirus/2019-ncov/index.html
– CDC Spanishhttps://espanol.cdc.gov/enes/coronavirus/2019-ncov/index.html
– World Health Organization https://www.who.int/health-topics/coronavirus
– LA County residents can also call 2-1-1
William S. Hart Union High School District COVID-19 Dashboard
Since the State of Emergency has been lifted, the William S. Hart Union High School District will no longer be posting dashboard information.
Santa Clarita Valley Update
The L.A. County Public Health dashboard reported one additional death from COVID-19 in Acton and one new death in Lake Hughes, bringing the total number of deaths in the SCV to 579.
NOTE: As of Dec. 20, 2022, the Los Angeles County Department of Public Health switched to a new geocoding process to improve the accuracy and completeness of geocoded data. Geocoding is the process of assigning an address to specific geographic coordinates (latitude/longitude). As a result, approximately 1,500 cases (0.04%) were removed from the cumulative count as they were determined to be out of jurisdiction with the improved geocoding. The switch to this improved process also resulted in minor changes to cumulative case/death counts by Supervisor District, Service Planning Area, city/community, and area poverty categories.
The following is the community breakdown of the 582 deaths in the SCV per L.A. County’s dashboard:
Santa Clarita: 471
Castaic: 33
Acton: 21
Stevenson Ranch: 19
Unincorporated Canyon Country: 11
Agua Dulce: 8
Val Verde: 6
Elizabeth Lake: 4
Lake Hughes: 3
Valencia: 2
Unincorporated Bouquet Canyon: 2
Newhall: 1
Unincorporated Saugus/Canyon Country: 1
SCV Cases
Of the 103,217 cases reported to Public Health for the SCV to date, the community breakdown is as follows:
City of Santa Clarita: 76,166
*Castaic: 10,042
Stevenson Ranch: 6,247
Canyon Country (unincorporated portion): 3,910
Acton: 2,099
Val Verde: 1,261
Agua Dulce: 1,029
Valencia (unincorporated portion west of I-5): 984
Saugus (unincorporated portion): 357
Elizabeth Lake: 299
Bouquet Canyon: 218
Lake Hughes: 209
Saugus/Canyon Country: 152
Newhall (Unincorporated portion): 109
Sand Canyon: 64
San Francisquito/Bouquet Canyon: 46
Placerita Canyon: 25
*Note: The county is unable to break out separate numbers for Castaic and PDC/NCCF because the county uses geotagging software that cannot be changed at this time, according to officials. Click here for the LASD COVID-19 dashboard.
California By the Numbers
California now reports weekly COVID updates on Fridays. Updated data as of Friday, Dec. 22:

For more California data, click [here].
Like this:
Like Loading...
Related


 Tweet This
 Facebook
 Digg This
 Bookmark
 Stumble
 RSS
RSS


REAL NAMES ONLY: All posters must use their real individual or business name. This applies equally to Twitter account holders who use a nickname.
0 Comments
You can be the first one to leave a comment.