The Los Angeles County Department of Public Health confirmed Friday 249 new laboratory confirmed cases and two new deaths from COVID-19 in the Santa Clarita Valley within the last week.
Public Health is now reporting COVID-19 data once a week. This is the most recent data from Jan. 19.
This new data brings Los Angeles County death totals to 37,209 case totals to 3,858,171 and Santa Clarita Valley case totals to 104,268 since March of 2020. SCV deaths from COVID-19 increase to 589.
Respiratory Virus Transmission Indicators Still Heightened from Winter Surge
The Los Angeles County Department of Public Health continues to report elevated levels of COVID-19, flu and respiratory syncytial virus (RSV) activity, underscoring the need for common-sense precautions even as we see slight declines in some indicators.
As COVID-19, flu and RSV continue to circulate in Los Angeles County, residents remain at increased risk of being exposed or exposing others to respiratory infections. People are encouraged to take common-sense precautions, such as getting vaccinated and, if sick, staying home, testing and seeking treatment, to protect themselves and the people around them from respiratory illness.
In Los Angeles County, wastewater concentrations of SARS-CoV-2, the virus that causes COVID-19, were up this week at 66 percent of last year’s winter peak, an increase from 60 percent reported last week, and significantly higher than the 36 percent reported on Dec. 27. Wastewater concentrations provide a more complete picture of COVID-19 transmission levels than reported cases alone.
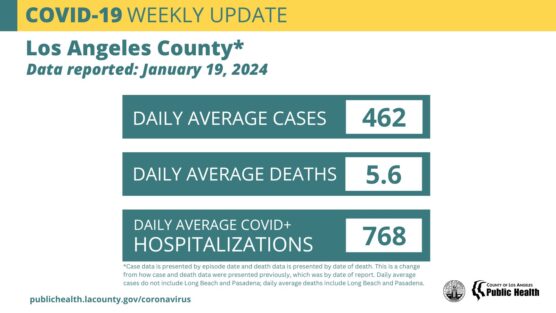
Some other indicators have declined slightly over the past week but remain elevated. Daily average cases in Los Angeles County fell to 462 from 483 a week earlier. Reported cases do not include home tests, so the actual number of COVID-19 infections in the community is much higher. There was a daily average of 768 COVID-positive hospitalized patients this week compared to 830 last week. However, average daily COVID-19 deaths increased to 5.6 for the week ending Dec. 25, 2023, up from 3.7 reported a week earlier. It is not unexpected to see increases in the death metric later than other metrics due to both the time needed to receive death certificates and the natural progression of the disease.
Los Angeles County’s COVID-19 Hospital Admission Level, as defined by the U.S. Centers for Disease Control and Prevention (CDC), has returned to the Low Level after two weeks at Medium Level. Last Friday, CDC reported 9.8 new COVID-19 hospital admissions in Los Angeles County per 100,000 people for the week ending Jan. 6. Today, CDC reported 9.6 new COVID-19 hospital admissions per 100,000 people for the week ending Jan. 13.
Los Angeles County’s masking requirement for inpatient facilities as outlined in the Health Officer Order posted on Dec. 27, 2023, remains in effect despite the change in CDC Hospital Admission Levels. The new COVID-19 Hospital Admission Level for Los Angeles is hovering just below 10, with rates of 9.8 and 9.6 per 100,000 for the past two weeks. To continue to better protect patients in licensed healthcare facilities that provide inpatient care while COVID-19 transmission remains elevated and the hospital admission rate remains very close to 10, Los Angeles County will maintain required masking by staff and visitors in these facilities. Public Health will reassess the requirement in two weeks to allow for additional time to confirm a sustained decline in the new COVID-19 Hospital Admission Level to Low and to decrease the chance of needing to quickly reinstate the masking requirement in these facilities.
Flu and RSV also have seen small declines while continuing to spread at elevated levels in Los Angeles County. There was an average of 345 influenza-positive hospitalized patients per day for the week ending Jan. 6, a decrease from the average of 425 influenza-positive hospitalized patients per day the week before. For the week ending Jan. 6, 14.8 percent of specimens tested for influenza at sentinel surveillance laboratories were positive, similar to levels seen at the beginning of December. For the same week, 11 percent of specimens tested for RSV at sentinel surveillance laboratories were positive.
To help reduce the spread of respiratory illness, people experiencing respiratory symptoms, such as coughing, sneezing, sore throat or fever, should test for COVID-19. If they are positive, they should seek treatment, which can decrease the severity and length of illness and reduce the risk of long COVID. Oral antivirals also are available to reduce the chances of getting very sick from the flu.
One of the best and most effective ways to prevent serious illness remains vaccination. Public Health encourages residents to get the updated COVID-19 vaccine for maximum protection against new strains and waning immunity. It makes sense to also get the flu vaccine in January because a second wave of flu in the early spring is not uncommon. To find a vaccination site, visit myturn.ca.gov.
Free vaccines, at-home test kits and medicines to treat both COVID-19 and flu may be accessed through Public Health, regardless of insurance or immigration status. Call the Public Health InfoLine at 1-833-540-0473 with health-related questions and for help making a telehealth appointment or getting a prescription for COVID-19 medication. The InfoLine is free to use and open seven days a week from 8 a.m. to 8 p.m.
Public Health reports COVID-19 data weekly. The following table shows case, wastewater, emergency department, hospitalization, and death data in Los Angeles County over the past four weeks.

All daily averages are 7-day averages. Data for past weeks are subject to change in future reports. Time periods covered by each metric: cases = week ending each Saturday; wastewater = week ending each Saturday, with a one-week lag; ED data = week ending each Sunday; hospitalizations = week ending each Saturday; deaths = week ending each Monday, with a three-week lag; death percentage = week ending Monday, with a one-week lag.
Case data is presented by episode date, an approximation of the date the illness began, and death data is presented by date of death. This is a change from how case and death data were presented prior to July 26, 2023, which was by date of report. Daily average cases do not include Long Beach and Pasadena. Daily average deaths include Long Beach and Pasadena for all weeks except 1/3/24. Long Beach and Pasadena are not included in the daily average death count for 1/3/24 because data was not available from CDPH due to the holiday.
A wide range of data and dashboards on COVID-19 from the Los Angeles County Department of Public Health are available on the Public Health website at http://www.publichealth.lacounty.gov including:
COVID-19 Locations & Demographics (data by demographic characteristics and geography, active outbreaks, and citations)
– COVID-19 Response Plan
– COVID-19 Vaccinations
– Skilled Nursing Facility Metrics
Always check with trusted sources for the latest accurate information about novel coronavirus:
– Los Angeles County Department of Public Health: http://publichealth.lacounty.gov/media/Coronavirus/
– California Department of Public Health: https://www.cdph.ca.gov/Programs/CID/DCDC/Pages/Immunization/nCOV2019.aspx
– Centers for Disease Control and Prevention: https://www.cdc.gov/coronavirus/2019-ncov/index.html
– CDC Spanishhttps://espanol.cdc.gov/enes/coronavirus/2019-ncov/index.html
– World Health Organization https://www.who.int/health-topics/coronavirus
– LA County residents can also call 2-1-1
William S. Hart Union High School District COVID-19 Dashboard
Since the State of Emergency has been lifted, the William S. Hart Union High School District will no longer be posting dashboard information.
Santa Clarita Valley Update
The L.A. County Public Health dashboard reported one additional death from COVID-19 in Acton and one new death in Lake Hughes, bringing the total number of deaths in the SCV to 579.
NOTE: As of Dec. 20, 2022, the Los Angeles County Department of Public Health switched to a new geocoding process to improve the accuracy and completeness of geocoded data. Geocoding is the process of assigning an address to specific geographic coordinates (latitude/longitude). As a result, approximately 1,500 cases (0.04%) were removed from the cumulative count as they were determined to be out of jurisdiction with the improved geocoding. The switch to this improved process also resulted in minor changes to cumulative case/death counts by Supervisor District, Service Planning Area, city/community and area poverty categories.
The following is the community breakdown of the 589 deaths in the SCV per L.A. County’s dashboard:
Santa Clarita: 476
Castaic: 35
Acton: 21
Stevenson Ranch: 19
Unincorporated Canyon Country: 11
Agua Dulce: 8
Val Verde: 6
Elizabeth Lake: 4
Lake Hughes: 3
Valencia: 2
Unincorporated Bouquet Canyon: 2
Newhall: 1
Unincorporated Saugus/Canyon Country: 1
SCV Cases
Of the 104,268 cases reported to Public Health for the SCV to date, the community breakdown is as follows:
City of Santa Clarita: 76,970
*Castaic: 10,118
Stevenson Ranch: 6,313
Canyon Country (unincorporated portion): 3,949
Acton: 2,111
Val Verde: 1,274
Agua Dulce: 1,038
Valencia (unincorporated portion west of I-5): 995
Saugus (unincorporated portion): 361
Elizabeth Lake: 307
Bouquet Canyon: 221
Lake Hughes: 214
Saugus/Canyon Country: 153
Newhall (Unincorporated portion): 109
Sand Canyon: 64
San Francisquito/Bouquet Canyon: 46
Placerita Canyon: 25
*Note: The county is unable to break out separate numbers for Castaic and PDC/NCCF because the county uses geotagging software that cannot be changed at this time, according to officials. Click here for the LASD COVID-19 dashboard.
California By the Numbers
California now reports weekly COVID updates on Fridays. Updated data as of Friday, Jan. 19:

For more California data, click [here].
Like this:
Like Loading...
Related


 Tweet This
 Facebook
 Digg This
 Bookmark
 Stumble
 RSS
RSS


REAL NAMES ONLY: All posters must use their real individual or business name. This applies equally to Twitter account holders who use a nickname.
0 Comments
You can be the first one to leave a comment.